Applies to SQL Server 2019, 2022 and 2025.
The Query Store capture mode decides which queries SQL Server bothers to record. Turning Query Store on is only half the job: the capture mode controls whether every statement gets stored, only the ones that matter, or nothing new at all. I’ve seen it set to ALL “so we don’t miss anything” more than once, and it usually ends with a full Query Store and no history.
The four Query Store capture modes
QUERY_CAPTURE_MODE is a database-level option with four values:
- ALL: records every query that runs, including one-off ad hoc statements that never come back.
- AUTO: records a query only once it is worth recording, based on how often it runs and how much CPU it uses to compile and execute. This has been the default since SQL Server 2019.
- CUSTOM: like AUTO, but you set the thresholds yourself with QUERY_CAPTURE_POLICY. Added in SQL Server 2019.
- NONE: stops capturing new queries. Queries already in Query Store keep getting runtime statistics.
From SQL Server 2022, new databases get Query Store switched on in READ_WRITE mode with AUTO capture. A database restored or upgraded from an older version keeps whatever settings it had, so check rather than assume.
Checking the current capture mode
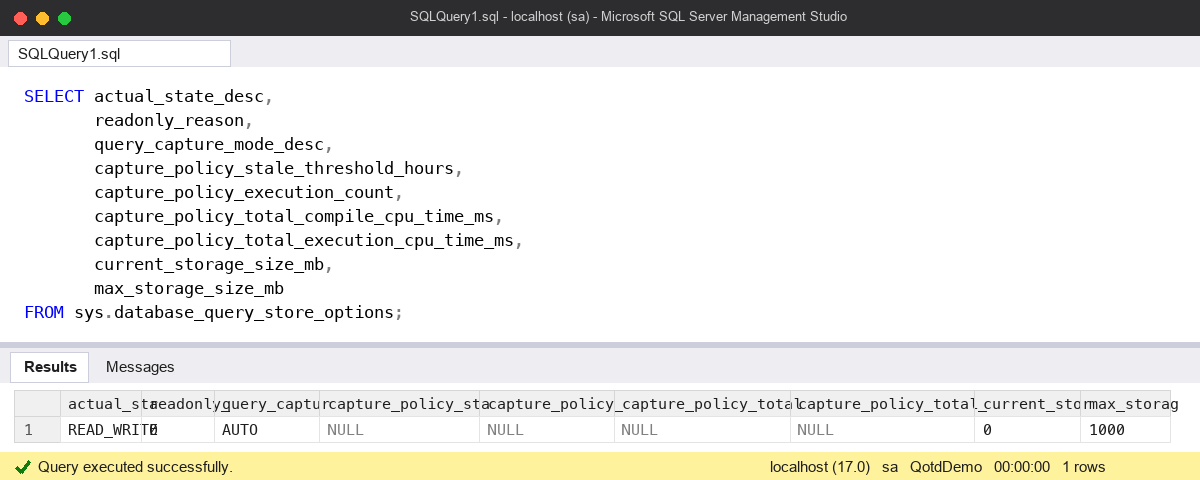
Run this in the database you care about. The capture_policy columns show the thresholds AUTO and CUSTOM work to:
SELECT actual_state_desc,
       readonly_reason,
       query_capture_mode_desc,
       capture_policy_stale_threshold_hours,
       capture_policy_execution_count,
       capture_policy_total_compile_cpu_time_ms,
       capture_policy_total_execution_cpu_time_ms,
       current_storage_size_mb,
       max_storage_size_mb
FROM sys.database_query_store_options;
If actual_state_desc says READ_ONLY when you asked for READ_WRITE, look at readonly_reason. A value of 65536 means Query Store reached MAX_STORAGE_SIZE_MB, and it has stopped recording anything new.
How AUTO and CUSTOM decide
Both work over an evaluation window, the stale capture policy threshold, which is one day by default and can be set from one hour to seven days. Within that window a query is captured if it meets any one of these:
- it runs at least EXECUTION_COUNT times (default 30)
- it uses at least TOTAL_COMPILE_CPU_TIME_MS of compile CPU (default 1000 ms)
- it uses at least TOTAL_EXECUTION_CPU_TIME_MS of execution CPU (default 100 ms)
So a report that runs once a day but burns two seconds of CPU still gets captured. The thing that doesn’t get captured is the cheap one-off statement, which is exactly the noise you want to leave out.
If the defaults miss things you care about, switch to CUSTOM and tune them. Here I shorten the window and lower the execution count for a quieter database:
ALTER DATABASE [YourDB]
SET QUERY_STORE = ON
(
    OPERATION_MODE = READ_WRITE,
    QUERY_CAPTURE_MODE = CUSTOM,
    QUERY_CAPTURE_POLICY =
    (
        STALE_CAPTURE_POLICY_THRESHOLD = 12 HOURS,
        EXECUTION_COUNT = 10,
        TOTAL_COMPILE_CPU_TIME_MS = 1000,
        TOTAL_EXECUTION_CPU_TIME_MS = 100
    )
);
The common mistake: ALL to track every query
The mistake I see most is setting QUERY_CAPTURE_MODE = ALL because someone wants to “track all the queries”. On a database with a lot of unparameterised ad hoc SQL, each distinct literal produces its own query text and plan. Query Store fills with thousands of single-run statements, cleanup works harder, and eventually the store hits its size limit and flips to READ_ONLY. From then on you’re not tracking all the queries, you’re tracking none of the new ones.
You can see how much of your Query Store is single-use noise with this:
SELECT COUNT(*) AS single_run_queries
FROM (
    SELECT p.query_id
    FROM sys.query_store_plan AS p
    JOIN sys.query_store_runtime_stats AS rs
        ON rs.plan_id = p.plan_id
    GROUP BY p.query_id
    HAVING SUM(rs.count_executions) = 1
) AS x;
If that number is a large share of sys.query_store_query, ALL is costing you more than it gives. I use ALL only for a short, deliberate investigation on a test or quiet system, then put it back to AUTO.
The second mistake is the opposite one: setting NONE and thinking Query Store is now off. It isn’t. Existing queries still collect runtime statistics and the data still takes space. If you really want it off, use SET QUERY_STORE = OFF, but think twice, because you lose the history you’d want for a plan regression.
Watch out for
- Cursors, statements inside stored procedures and natively compiled queries are always captured under ALL, AUTO and CUSTOM, so AUTO won’t filter a busy procedure out.
- A query that sits below the thresholds isn’t in Query Store at all, so it won’t appear in the regression reports. Use the plan cache or Extended Events for those.
- Changing the capture mode only affects what gets captured from now on. It doesn’t remove anything already stored.
- Keep an eye on current_storage_size_mb against max_storage_size_mb, whatever the mode.
For finding the queries Query Store does capture, see my posts on measuring query performance and Query Store regressions, or the rest of the SQL Server DBA Handbook. Microsoft documents every option in ALTER DATABASE SET options and the Query Store best practices page.
This topic came up in the SQLServerCentral Question of the Day: Tracking All the Queries.
Clive Roberts DBA